Tuesday, June 09, 2015

W/m^2, Altitude and the Hour Record. Part III

In my previous posts on this topic I explored the impact of altitude on the hour record. You can recap by clicking on the links here:

W/m^2, Altitude and the Hour Record. Part I
W/m^2, Altitude and the Hour Record. Part II

In summary, the primary impacts on the speed attainable (or distance attainable for an hour) are:

1. Physiological - the reduction in sustainable aerobic power as altitude increases due to the reduced partial pressure of Oxygen, and

2. Physical - the reduction in aerodynamic drag as altitude increases due to the reduction air density.

Of course there are other factors - variable track surfaces and geometry, logistical, financial, physiological and so on, but for the purpose of this exercise I have confined analysis to the primary physiological and physical impacts.


These primary competing factors - reduced power and reduced drag combine to mean that in general an increase in altitude means a greater speed is attainable. In other words, the benefit of the lower air resistance at higher altitude typically outweighs the reduction in power. But not always.

The level of impact to speed is individual and is a function of each individual's physiological response to altitude - while the physics side of the equation is the same for everybody. I covered this in more detail in Part II of this series, and used data from several studies which provide four formula for the average impact of altitude on power output.

I plotted the different formula depending on whether athletes had acclimatised to altitude or not.


This chart should be fairly intuitive - further up in altitude you go, the more power you lose compared with sea level performance. The vertical scale of the chart amplifies the differences between them, which are not large, but also not insignificant either. A key element was the difference between athletes that had acclimated to altitude and those who had not.

Then I layered on that the physics impact of reducing air resistance, but the resulting chart was not quite as intuitive to follow and so I decided to revisit this another way.

Hence exhibit A below (click on the image to view larger version):


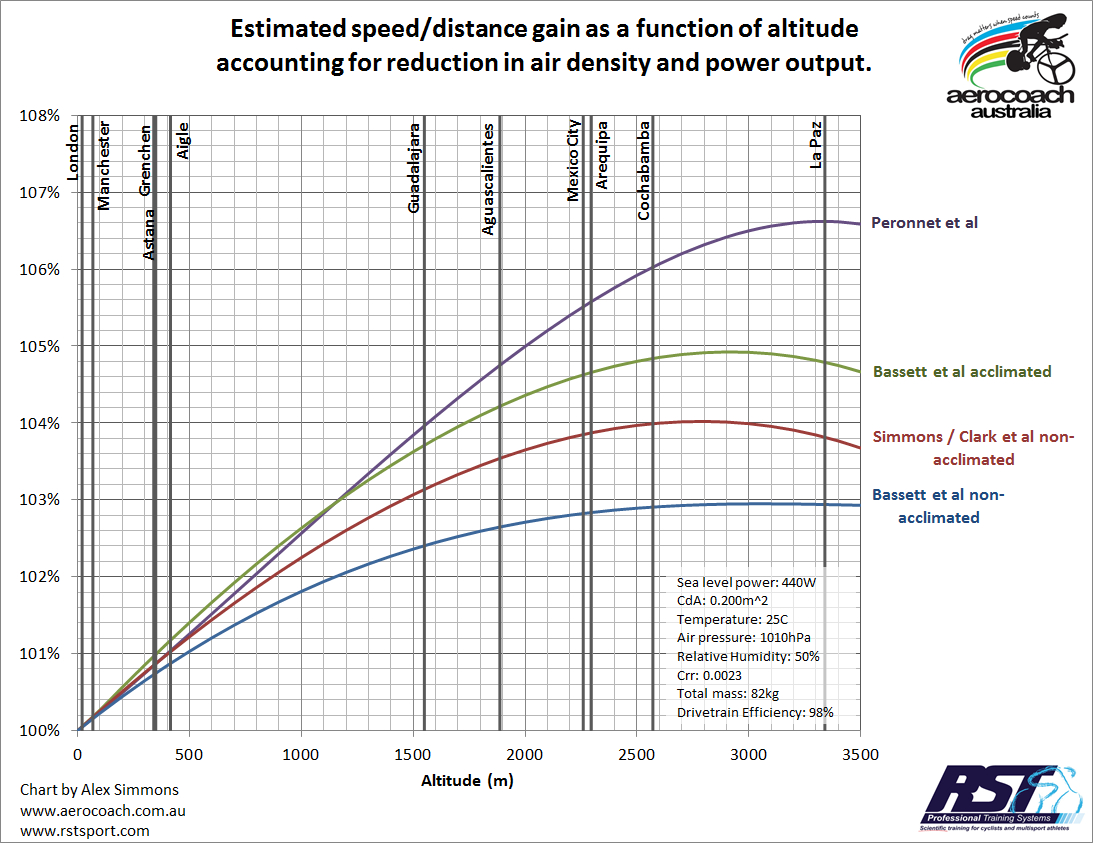
This should be reasonably straightforward to interpret, but even so I'll  provide some explanation.

The horizontal axis is altitude and the dark vertical lines represent the altitude of various tracks around the world.

The vertical axis is the proportion of sea level speed attainable.

The curved coloured lines represent the combined impact of both a reduction in power using each of the formula discussed in Part II of this series, combined with the reduction in air resistance.

So for example, if we look at the green line (Basset et al acclimated), this shows that as an cyclist increases altitude, they are capable of attaining a higher speed up until around 2,900 metres, and any further increase in altitude shows a decline in the speed attainable, as the power losses begin to outweigh the reduction in air density.

The track in Aigle Switerland represents around a 1% speed gain over London, while riding at Aguascalientes would provide for between a 2.5% to 4% gain in speed. Head to Mexico City and you might gain a little more, but as the chart shows, the curves begin to flatten out, and so the risk v reward balance tips more towards the riskier end of the spectrum.

Altitude therefore represents a case of good gains but diminishing returns as the air gets rarer. Once you head above 2,000 metres, the speed gains begin to taper off, and eventually they start to reduce, meaning there is a "sweet spot" altitude.

Caveats, and there are a few but the most important are:
-  any individual's sweet spot altitude will depend on their individual response to altitude - the plotted lines represent averages for the athletic groups studied;
- the formula used have a limited domain of validity, while the plotted lines extend beyond that, a point I also covered in Part II of this series;
- these are not the only performance factors to consider, but are two of the most important.

I suspect that the drop off in performance with altitude might occur a little more sharply for many than is suggested here. Nevertheless, the same principles apply even if your personal response to altitude is on the lower end of the range, and it is hard to imagine why anyone would suggest that heading to at least a moderate altitude track is a bad idea from a performance perspective.

Alex Dowsett rode 52.937km at Manchester earlier this year. At Aguascalientes he could reasonably expect to gain ~3.5% +/-0.5%  more speed, or just about precisely what Bradley Wiggins attained in London.

Read More......

Monday, June 08, 2015

Density matters

I saw a question today from someone who read recent comments about how high air pressure resulted in Brad Wiggins' hour distance being less than it might otherwise have been with more favourable conditions.

He was wondering if you can control air pressure in velodromes, or choose a time of year when it is lower. So can we do that?

Climate control


While there are velodromes where the inside air temperature is controllable (mostly northern hemisphere tracks located in cold climates), the control of air pressure is not something possible at any currently existing track that I'm aware of.

It would require quite a deal of engineering, in particular to provide an air lock / sealed environment that enables lots of people (and service vehicles) to enter /exit the building without affecting inside pressures and which meets emergency evacuation requirements for a large crowd, as well as fresh air to breathe. I don't see that happening any time soon.

Air locks do exist, e.g. at Aguascalientes velodrome in Mexico they use an air pressure differential to support the roof, but that means the air pressure inside the velodrome needs to be higher than outside. Not by much, but it will always need to be higher relative to local weather conditions, and inside the velodrome air pressure will still vary relative to outdoors.

So what about picking a better time of year?


Well let's look at the daily barometric pressure readings near London for the past three and a half years. Source for these charts is the National Physical Laboratory in the UK.

Barometric pressure London Jan-Dec 2012

Barometric pressure London Jan-Dec 2013

Barometric pressure London Jan-Dec 2014

Barometric pressure London Jan-June to date 2015

Looking at the above, it's pretty clear there is no obvious pattern to suggest a time of year when barometric pressure will be, on the balance of probabilities, lower.

Air density is what matters.

Air pressure of course is not the only variable. What really matters is attaining as low an air density as is physiological sensible. Air density along with a rider's aerodynamics, ie. their CdA, determines the energy demand for riding at a given speed, and lower air density is desirable for greater speed, provided of course the means to achieve that lower density doesn't reduce a rider's power to the extent performance ends up being worse. e.g. by riding at such high altitudes or temperatures that the rider's power output is compromised to a greater extent than the air density benefit provides.

Air density is a function of:
- air temperature
- barometric pressure
- altitude
- relative humidity

You can pretty much discount the latter as the changes in air density is very small with changes in humidity, although for the record humid air is slightly less dense than dry air (at same temperature, pressure and altitude).

Air density reduces with increasing temperature and altitude, and with reducing barometric pressure.

Since attempting to reduce air pressure either via climate control or by picking suitable times of year is not really an option, that leaves us with adjusting the other two variables - temperature and altitude.

I've discussed altitude before in this item. I'm going to revisit it in a future post in an attempt to simplify the impact of the variables involved.

Heating the air inside a velodrome is common, and this was attempted with some powerful portable heating devices during Jack Bobridge's unsuccessful attempt earlier this year, and in the case of attempts at most northern hemisphere tracks, the temperature has been dialled up to the rider's desired level.

Wiggins did specific heat acclimation work and reports are the temperature inside the velodrome was around 28-30C. That's pretty warm - going too hot can be detrimental as power losses can occur with inadequate cooling. As I said earlier, it's a balance between a physical benefit and a potential physiological cost.

Read More......

Wiggo's Hour

Just a short one today to update the chart from the one I posted here and on other social media forums. Click to see bigger version.


54.526km

Different reports of barometric pressure of 1031-1036hPa and air temp of 30.3C inside the track mean that Wiggins must have been exceptionally aerodynamic and recent work on his bike and position at the track suggest some good aero gains were made.

I estimate a power to CdA ratio of 2500-2550W/m^2 was required.

There are of course a range of assumptions:
Total mass: 82kg
Crr: 0.0023
Drivetrain efficiency: 98%
Altitude: 50m
Relative Humidity: 60%

If drivetrain efficiency is better, say 99% and Crr at 0.0020, then it drops the power to CdA ratio down to 2200-2220W/m^2.

and perfect pacing.

Just on that, my colleague Xavier Disley has once again produced a lap pacing chart - here it is:


That's a very slight fade over the course of an hour, which in my humble opinion is pretty much perfect. Opening few laps a bit hard, but that's understandable as a rider seeks to control the adrenaline rush with thousands in the crowd watching on and cheering.

The high air pressure did cost distance, and on another day perhaps 55km was within reach

As for going to high altitude, well there are many variables, but another 1-2km is feasible. See this item for more on that.

Well done to Brad Wiggins. That's sure a fine ride.

Read More......

Saturday, June 06, 2015

Pressure on the Hour

My colleague Xavier Disley did up a neat chart showing the impact the daily variability of barometric pressure can have on the distance attainable for an hour record, and how it's looking given the weather forecast when Xav last did the chart:


Nice - it shows how much breaking a record can still come down to a bit of luck with weather.

I think in Wiggins' case, assuming no major execution (i.e. totally crummy pacing) or mechanical issues, he'll break Dowsett's current mark no matter the weather as his power to drag ratio is sufficiently higher than Dowsett to overcome a slow air day.

But to set an outstanding mark such as Rominger's record, he'll need luck on his side. High pressure days are not good for speed.

Below is another version of this relationship between barometric pressure and distance attainable for four combinations of power and aerodynamic drag (CdA) values.


The chart is pretty self explanatory. For each combination of power and CdA chosen, the distance attainable reduces as barometric pressure increases.

That's because higher air pressure means a higher density of air molecules, and more air molecules to push out of the way requires more power.

A 60hPa difference in barometric pressure is equivalent to about 1km difference in distance attainable for the hour for the same power and CdA. That's a wide range of barometric pressure though, and variations are not normally quite that wide in most locations.

But a variation of half that is certainly possible over just a few days of varying weather as can be seen in Xavier's chart above.

I chose two power outputs: 430W and 450W, and two CdA values: 0.20m^2 and 0.19m^2. I don't know what Wiggins' power nor CdA value actually is or will be on the day, but for the sort of speeds he's likely to attain, these are in the ballpark.

It's the ratio of power (W) to aero drag coefficient CdA (m^2) that primarily determines the speed or distance attainable. hence why we refer to power/CdA ratio as measured by W/m^2. This chart covers a power to drag ratio range of 2150-2370 W/m^2.

Read More......

Friday, June 05, 2015

Where will Wiggo wind up?

Chart showing the progress of the UCI hour record since 1893 (click on it to view a bigger version):


The chart shows all the successful hour records recorded by the UCI. It doesn't show failed attempts.

The blue dots show the incremental increase in what is the absolute furthest distance attained.

The red dots show successful records for various categories of hour record but that did not surpass the furthest record for all categories up to that date.

For example, up until the early 1990s, the UCI had separate hour record categories for:
- amateur and professional riders
- above and below 600 metres altitude
- indoor and open air tracks

As a result, there were six categories of hour record for the period from about 1940 to the early 1990s.

And of course there have been bike/equipment regulation changes at times, most notably after Obree's and Boardman's records in the mid 1990s,

So where will Bradley Wiggins end up?


I'm pretty sure it'll be another red dot and not get close to Boardman's 1996 record and I doubt he'll beat Rominger's 1994 mark either. But he will likely beat Alex Dowsett's record (52.937km - the currently recognised record) by 1km or so.

I think anything above 54km will be very tough going. 54.5km perhaps if things go well. Closer towards 55km if everything is perfect.

Power 440-460W
CdA - who knows?

Say 0.200m^2.

Such a power range would net him around 53.5 - 54.4km at typical air density. 
On a low air density day that range would stretch to 54.5 - 55.4km. 

Weather forecast suggests low air density is unlikely although there is plenty of chat that they will raise the air temperature a lot, even up to 32C (yikes!).

So if velodrome air is heated to say 30C and air pressure is say 1020hPa, then at that power range and guessed CdA, the distance for a well paced effort will be in the 53.9 - 54.7km range.

Of course his CdA is the big unknown. Looks like he's been doing some work on it.

Drop that to 0.190m^2 and we can add about another lap (260 metres) to those estimated ranges.


Best of luck to Wiggo!

Read More......